


So, as I’ve been working through the Data Scientist career path on Codecademy (for some solid fundamentals), I skipped ahead to the first off-platform portfolio project. There was a lot of overlap at the start of the course on Python basics (I’m comfortable enough to not go through this again), so I thought I would learn the rest as I went along and fill any gaps.
I’m placing a focus on off-platform work as this will most closely match any day to day work I get in a real job. I also need to be as comfortable with these Python tools as possible and not rely on the Codecademy interface. This post will document my process:
Day 1 – Project Scope and plan of action
The aim of the project is to take a raw CSV file containing medical insurance payout information, manipulate the data into something readable, analyse it and draw some conclusions. I currently work in the medical field so this is actually something that I can see happening in a business. After reviewing the data, there are over a thousand rows of; client age, sex, bmi, children, smoker (y/n), region and charges on the account.
For the sake of tracking my progress I identified 5 objectives for the data:
- Average age of client (Let’s ease myself into this with an easy one)
- How do the number of children impact the client profile?
- Charges per area (I might be able to visualise this nicely with MatPlotLib)
- Which gender has the highest charges? (Then I might be able to break this down into age bracket)
- Average age of client with 1 child or more. (This kind of data could be used when targeting new customers online etc)
Immediately, this has identified some areas that I need to brush up on; Using the mac terminal, working in Jupyter Notebooks, maybe classes?, working with files and manipulating data with pandas. Looks like a lot – let’s get started.
Using the Mac Terminal.
I’d already installed the necessary files last year, so to launch a new notebook you just put:
# Launch a new Notebook
jupyter notebook# Lists what is in the current folder
ls# Opens a [folder_name]
cd [folder_name]
Working in Jupyter Notebooks
Installing and opening jupyter is the hardest part of this. Once you are in the tool it’s quite self explanatory and very convenient. I also have PyCharm installed which allows me to code locally but this platform is a lot more accessible.
Day 2 – Concept Review
Classes Revision
Reviewing old topics and working through the advanced python course on DataCamp, I was always having trouble with classes. Similar to the way loops confused me at the start, it’s now the same with this. I had to go right back and review this from the beginning and it wasn’t easy.
I now understand how to build out classes with correct structure, but this was in a managed curriculum setting. Going forward it will be important to understand when and how to best use these within my own code. I can follow along with a guide, but implementing these myself will be the challenge. It’s also going to take time to learn the correct class syntax. I have notes now but it’s disheartening every time I need to look it up. I know this will come with time – understanding the WHEN/ HOW is more important for now.
To begin, towards_data_science has a nice explanation of what a class is:
A Python class is like an outline for creating a new object. An object is anything that you wish to manipulate or change while working through the code. Every time a class object is instantiated, which is when we declare a variable, a new object is initiated from scratch. Class objects can be used over and over again whenever needed.
Codecademy has a nice classes cheatsheet that I can refer to here. It will definately be worth doing some addition practice exercises on this before I proceed past this project.
Working with files
Working with files and scraping data from the web is one of the most exciting parts for me. It’s an easy way to see how my new python skills can be used in the ‘real’ world environment. Due to my professional background, I’ve always been comfortable in a spreadsheet so these skills tie together very well. Part of this project involves downloading, formatting and analysing a CSV file, so I needed to revise this topic.
…after doing some revision here, I’ve been able to import and view the content of the CSV file. First problem solved, now onto the next one. How can I manipulate this data into lists or dictionaries that I can use? This I believe is where Pandas come in. I think I can use them to move around and structure the data as I’d like. Then with NumPy (numerical python) to make calculations and MatPlotLib to visualise it. But…I can also do the first part of this with normal lists too.
#import the insurance costs CSV file
import csv
with open("insurance.csv") as insurance_raw:
insurance_raw = csv.DictReader(insurance_raw)
for row in insurance_raw:
print(row)
Although I remember Pandas from a previous course – the track hasn’t actually covered this topic yet. There must be a way I can disseminate this data using the concepts I’m already familiar with so I’m going to look a little deeper – If this fails, i’ll keep investigating my way and see where it goes…
…a few hours later
I was able to iterate through the spreadsheet and .append the info I needed into a new python list. For ages I had issues making calculations on the list until I realised I needed to convert the age strings to integers. I was able to do this with a list comprehension and then proceed. From here, it was simple math to calculate the average age:
average_age_of_client = sum(age_of_client_int) / len(age_of_client_int)
OBJECTIVE ONE: Average age of client: 39. DONE
Day 3 – Digging into file manipulation
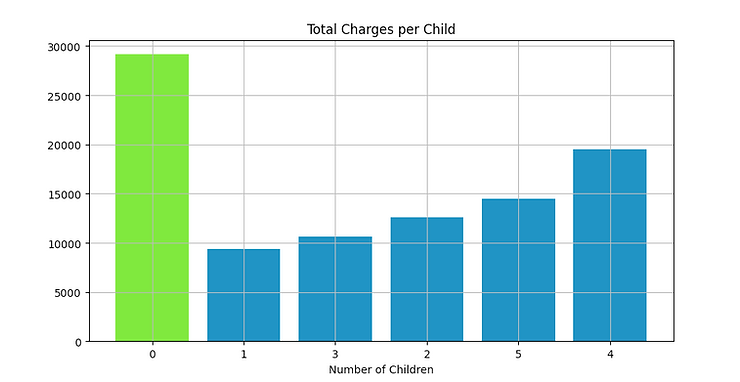
The next step was to do the same ‘data export’ but with different data points; in this case number of children and total amount of charges. I skipped ahead of my plan slightly, but chose to try and plot this information visually using MatPlotLib. I had to come off jupyter notebooks and into PyCharm for this as I couldn’t figure out how to import the library.
After combining two lists into a dictionary, then manipulating the data types from strings > floats > ints, (this sounds like a breeze, but it actually took me hours to realise the problem!) I was able to plot some basic charts. I looked at scatter diagrams and bar charts to see what would display the best and opted on this with some fancy formatting:
Verification
After looking into the data manually to check some out my output and verify my code, there was a problem. My list: dictionary comprehension (after converting both to INT lists wasn’t operating as expected). Individually, the lists were correct. As a dictionary, they were not. It turns out I did everything wrong.
List1: [0,1,3,0,0,0,1,3,2, ...]
List2: [16884, 1725, 4449, 2194, 3866, ...]
Dict1: {0:29141, 1:9377, 3:10600, ...]
#it looks like the key is correct, but the value is wrong
After some investigation and some help from the friendly users on the Codecademy forum, I realised dictionaries need a unique key and are unordered. As a result, my new dictionary was only 5 keys long; data for 0 – 5 children – each instance overwriting the last. What a mess…
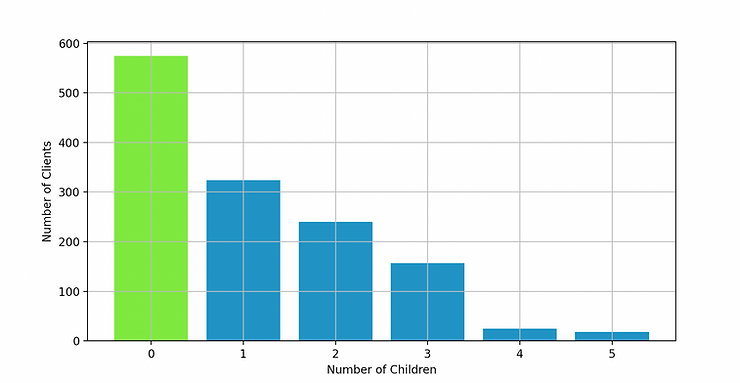
Onto the fix: I defined a new function that would iterate and count through my child list then add a running total to one_child, two_child, three_child etc attributes. I could then combine this with a simple [0,1,2,3,4,5] (number of children) list to create the dictionary of my dreams. This shows number of kids as the key and a count of clients with those kids as the value. Just what I need for my chart!
{0: 574, 1: 324, 2: 240, 3: 157, 4: 25, 5: 18}
In hindsight, the analysis of these data points is pretty basic and arguably useless… However, objective 2 has taught me a LOT of valuable lessons. I need a LOT more practice implementing python basics and a LOT of practice writing more condensed and simplified code.
OBJECTIVE TWO: How do the number of children impact the client profile? DONE
As you can see from the graph, the less children you have, the greater chance you’ll have to be a client. Most of the users have zero children (which may be most profitable for the business)
Summary
Today I was humbled and there is a lot I need to review. This is hours of work with very little to show. I could complete this entire project in excel in 20 minutes. The problem solving is bliss to me, I really enjoy it. However I need to spend more time mastering the fundamentals so it’s less about wishing with code and more about planning my overall approach then executing.
I didn’t even realise that dictionaries had to have unique keys and this threw me off for a long time trying to find a solution.
As a result, i’m going to stop this project here while I review some more of the fundamentals. I will continue my Data Scientist course on codecademy but keep coding off platform as much as possible. I found a super cool site called codewars that might be a good place to start.
Thanks for reading.
T3B